Sequence Diagram in Business Analysis
One of many diagram types used in Business Analysis, mentioned also in one of the previous posts on modeling, is Sequence Diagram. It has been defined in the UML notation as well. The Sequence Diagram is often perceived as rather ‘technical’ and ‘implementation-oriented’ and therefore intended mostly for software architects, developers, etc. Is it then useful in Business Analysis, especially when addressing the ‘business stakeholders’? It certainly is – under one condition. The key here is to use an appropriate level of abstraction. In other words: to model on a conceptual level.
Of course the Sequence Diagram has a substantial library of elements available. Advanced users can benefit from this plentiful when modeling complex interactions. But analysts are also free to use only a subset of elements offered by the UML notation. This way diagrams intended for ‘the business’ audience can be based only on these elements which are, in fact, straight forward to understand.
Basic elements of Sequence Diagram
So what exactly can be presented using a Sequence Diagram on a conceptual level? First and foremost: the participants of an interaction and messages they exchange. Let’s have a closer look at the available elements:
- Lifeline – represents participants of the interaction who exchange messages between each other
- Activation Box – indicates the time when certain participants are active (time taken to perform certain operation, process data)
- Message – a piece of communication transferred between participants of the interaction (the messages may be either synchronous or asynchronous)
Synchronous and asynchronous messages
The synchronous message differs from the asynchronous one in such a way that when a participant sends the synchronous message they relay control over the process. In other words, they cannot do anything until the response is received. A request for required data may serve as a good example. Once the request for required data is sent, the sending object stays all activity (it must do so) until a response arrives. This means that once the message is out, the process is controlled by the object to which it was sent, and it decides when an actual response will be send.
A different situation takes place in case of an asynchronous message. There is no need for the sender to await the response and it is free to perform further operations. A good example may be notifying the other participant of the interaction about the occurrence of an event without the need to await its response.
Chronological sequence of messages
The diagram presents the chronology of communicated messages. It is represented by the sequence of messages, from the top down. Messages sent more recently are located closer to the top, those sent before them, are placed in the lower parts.
When to use sequence diagrams
The Sequence Diagram is focused on interactions. It allows to present the interaction’s participants, sent and received messages (in the chronological order), the time when particular participants are active. It also provides the way to picture the difference between the synchronous and asynchronous message types.
The best use of Sequence Diagram is therefore when you need to present and define the Use Cases in a graphical form. The Sequence Diagram depicts the Use Cases graphically allowing easier understanding of dependencies, validation of initial assumptions, finding prospective errors or possibility for optimization. In other words, it allows to take full advantage of all abilities offered by the modeling, described in the previous article.
Sequence Diagram example
The below example presents the Sequence Diagram on a conceptual level, especially useful when dealing with the ‘business stakeholders’. Here, we use an example which is without a doubt a favorite one in IT – an ATM machine. Of course, this is a simplified model, made for the purpose of presenting the diagram’s abilities and does not reflect the real use case.
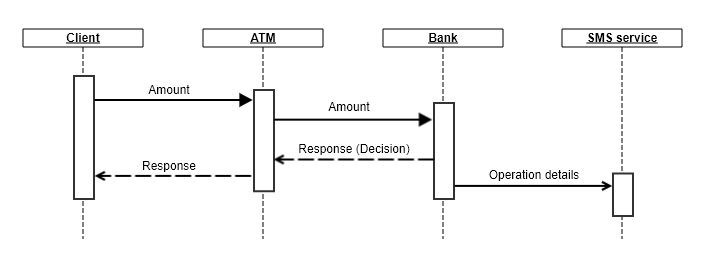
When using the above diagram, the following information can be conveyed:
This interaction involves 4 participants (represented by the Lifeline): Client, ATM, Bank, SMS Service. It is clear when a particular participant is active or not.
The interaction starts when the message is sent from the Client to the ATM. The message contains a certain amount. The message is also of a synchronous type, therefore the Client transfers the control over the process to the ATM and cannot do anything until a response message is received from the ATM.
Then, the ATM transfers the message to the Bank. The message contains the amount. In this case it is also a synchronous message and so the ATM awaits the response from the Bank. The Bank then sends the response to ATM, and subsequently, the response is conveyed by the ATM to the Client. This diagram presents the mechanism of how the synchronous messages are working: the response must be received before any further actions are taken.
Independently from transferring the response for the message received from the ATM, the Bank also sends a message to the SMS Service participant with the details of processed operation. The message to the SMS Service participant is asynchronous, so the Bank does not have to wait for the response and may continue the process.
The diagram also shows when a particular participant is active. The Client is active during the entire transaction, starting with sending the first message ending when the response is received. The SMS Service is activated when it receives the message from the Bank. Soon after its activity stops.
My recommendations
- Use the Sequence Diagram to clarify and validate previously described Use Cases
- Get to know the details of the UML notation regarding the Sequence Diagram
- Adjust the diagram’s level of complexity and abstraction to your audience
- Start with using simple elements of the notation and use it until the stakeholders become familiar with them, then introduce more advanced elements
Sources
A Guide to the Business Analysis Body of Knowledge® (BABOK® Guide). Version 3. 2015.
Diagram created with Gliffy